Personal collections

The table below shows the changes in the speed and time of the motion of a car during a journey.
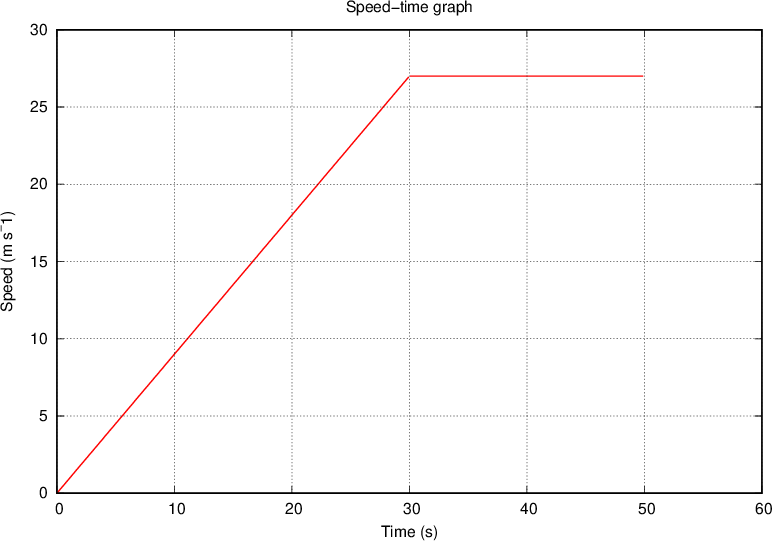
Draw a speed-time graph to represent the car's journey.
From the graph, calculate the acceleration of the car during the first  of the journey.
From the graph, determine the total distance travelled by the car during the journey.


 .
.

