Personal collections

The variation with time  of the sinusoidal current
  in a resistor of resistance
  is shown in the figure graph below.
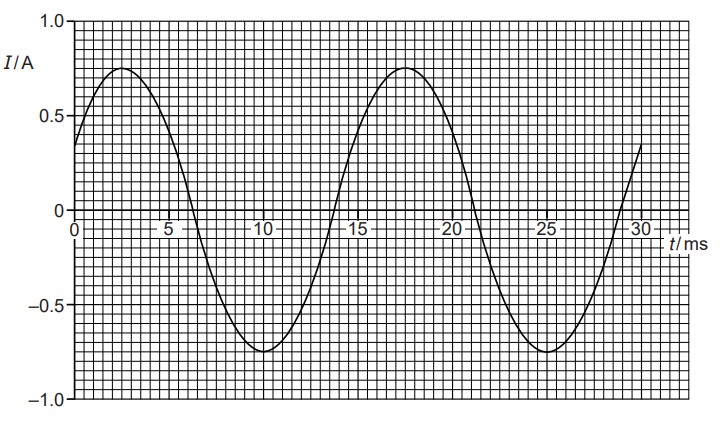
Use data from the graph above to determine, for the time  to
to  ,
,
the frequency of the current,
the mean current,
the root-mean-square (r.m.s.) current,
the energy dissipated by the resistor.


 .
. .
. .
.

