Personal collections

The variation with time  of the output
  of an alternating voltage supply of frequency
  is shown in the graph below.
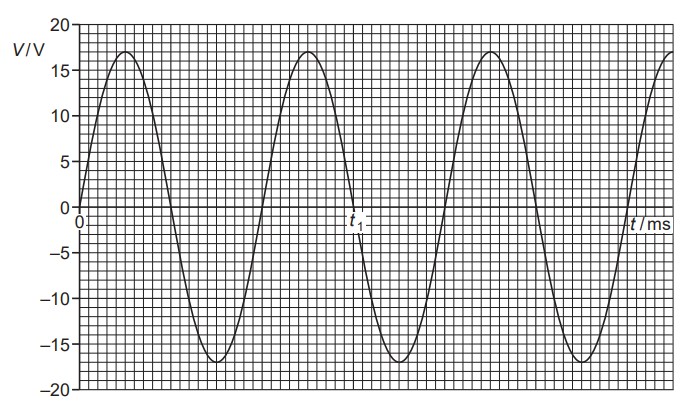
Use the graph above to state
the time  ,
,
the peak value  of the voltage,
the root-mean-square voltage  ,
,
the mean voltage  .
.
The alternating supply is connected in series with a resistor of resistance  . Calculate the mean power dissipated in the resistor.


 .
. .
. .
. .
.

