Personal collections

The table shows how many people visit a museum in five weeks.
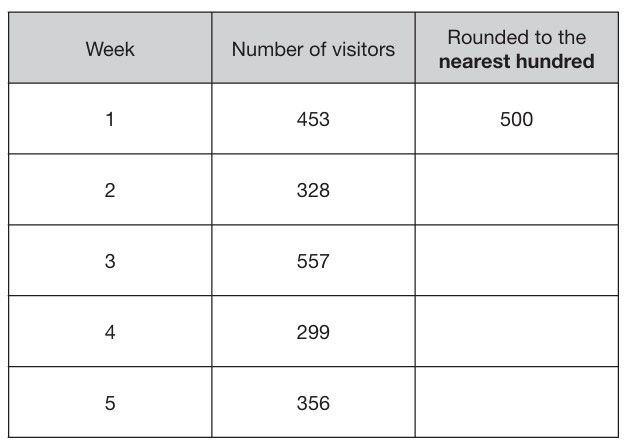
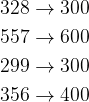
Complete the table above by rounding each number to the nearest hundred. The first one is done for you.
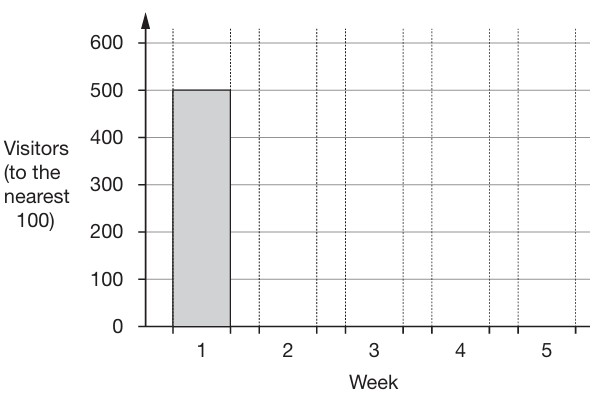
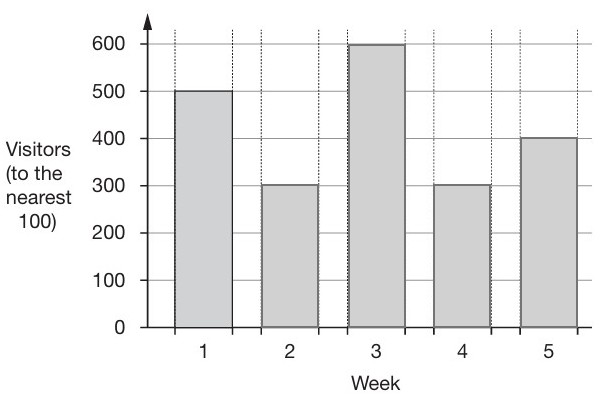
Now use the rounded values to complete the bar chart below. The first bar is done for you.