Personal collections

Starlings are birds that live in groups. The chart shows the ages of a group of starlings.
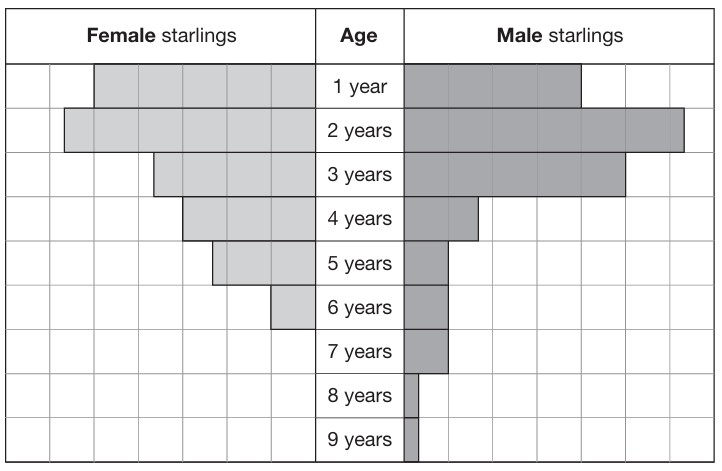
In the chart, each square represents 3 starlings.
More male starlings than female starlings are aged 6 years or older. How many more?


