Personal collections

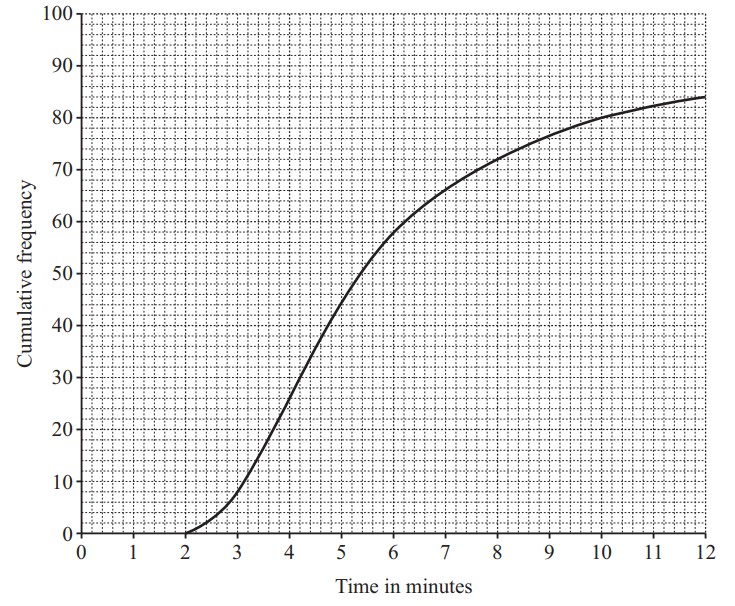
84 people attempt a particular puzzle. The times taken, in minutes, to complete the puzzle are recorded. These times are represented in the cumulative frequency graph below.
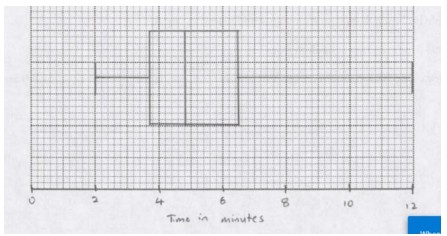
On the grid below, draw a box-and-whisker plot to summarise the information in the cumulative frequency graph.