Personal collections

The digital transmission of speech may be represented using the block diagram in the figure below.
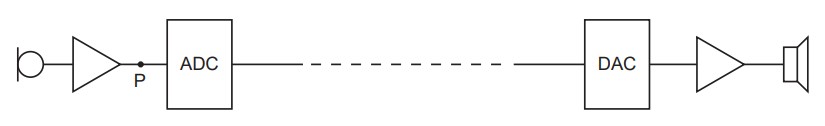
Part of the signal at point P on the figure above is shown in the graph below.
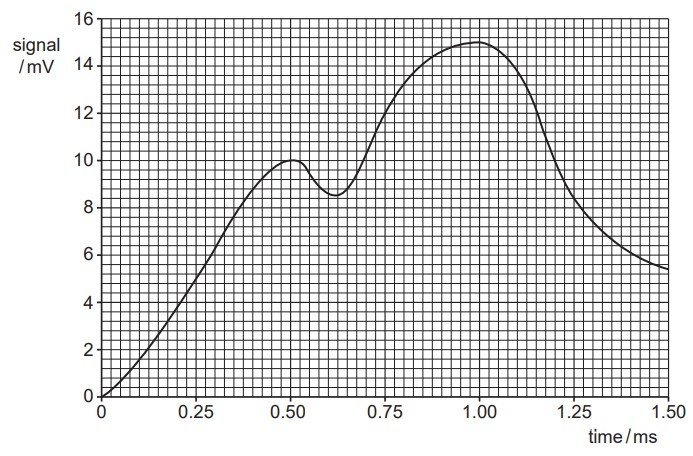
The analogue-to-digital converter (ADC) samples the signal at time intervals of  . Each sample is converted into a four-bit number with the smallest bit representing
  . Use the graph below to determine the four-bit number produced by the ADC at time

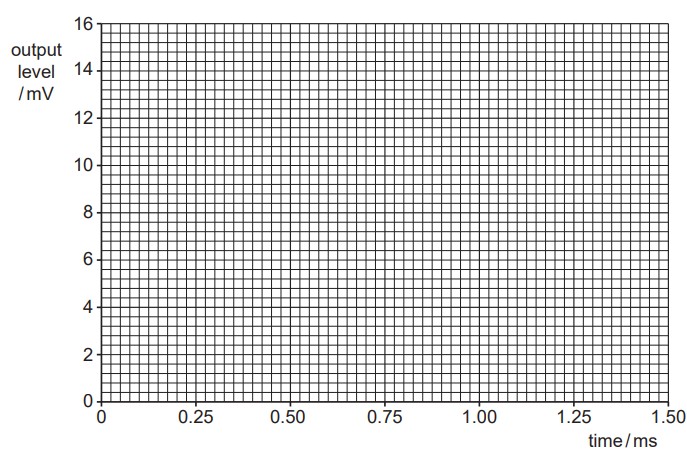
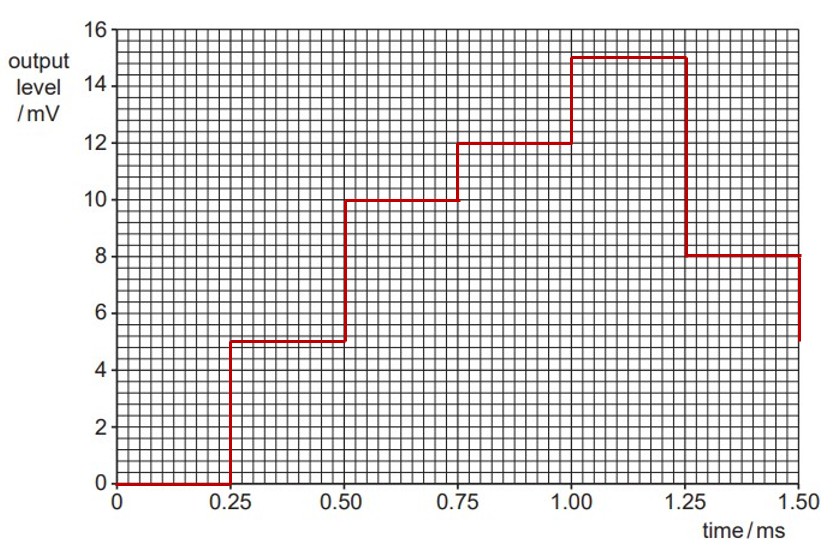
The digital number is transmitted and then converted to an analogue form by the digital-toanalogue converter (DAC). Use data from the graph above to draw, on the axes of the graph below, the output level of the DAC for time  to time
  . Assume that there is no time delay of the transmission of the signal between point P and the output of the DAC.