Personal collections

The time spent on the internet by each of 120 adults is recorded for one day. The cumulative frequency diagram shows this information.
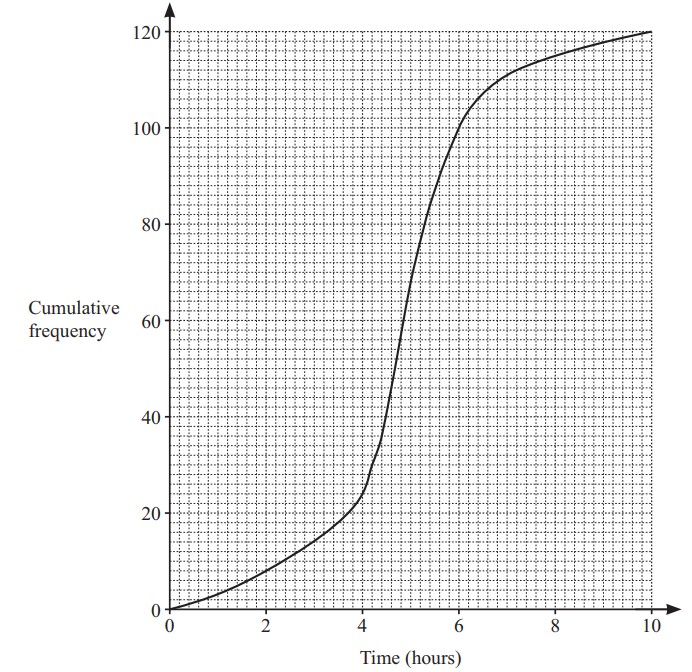
Use the cumulative frequency diagram to find an estimate of the interquartile range.


