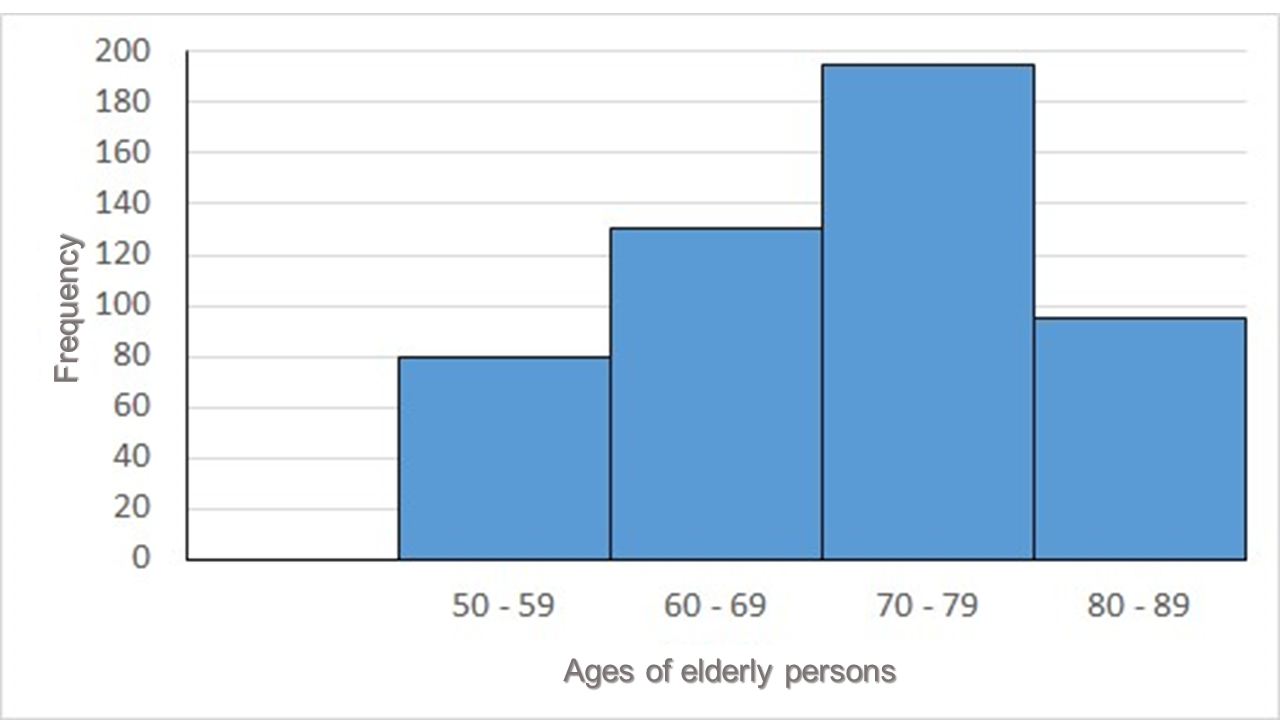
There are 500 people in a retirement home. 16% are aged 50 to 59 years. 130 are aged between 60 and 69 years, 195 are aged between 70 and 79 years. The rest are between the ages of 80 and 89 years.
Complete the table and calculate the relative frequencies.
Represent the data using a histogram.