
There are 300 students at the school. The pie chart shows their grades in mathematics.
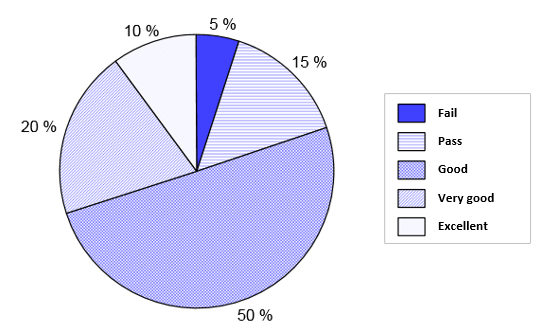
Record the data in Table 1.
Calculate the average grade in mathematics at this school.
Calculate the center angles belonging to each estimate in the pie chart. Record the calculated angles in Table 2.
Table 1.
Table 2.


