Personal collections

The histogram below shows the ages of the members of a local sports club.
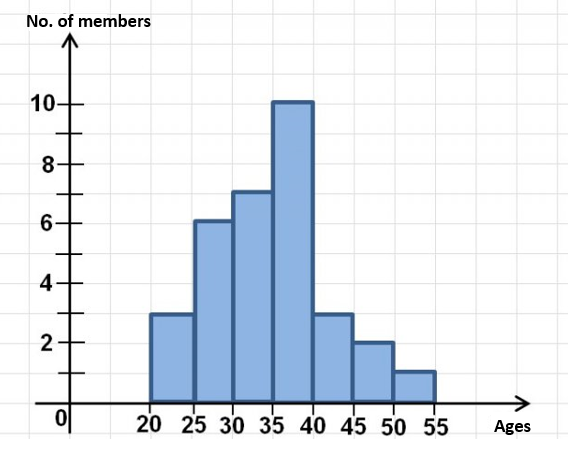
Read the number of members over 45 from the chart.
Read the number of members between 30 and 35 from the chart.
How many members does the club have?


