The company planned to have an average monthly income of  in the first term of the year. It generated
  euros as income in January,
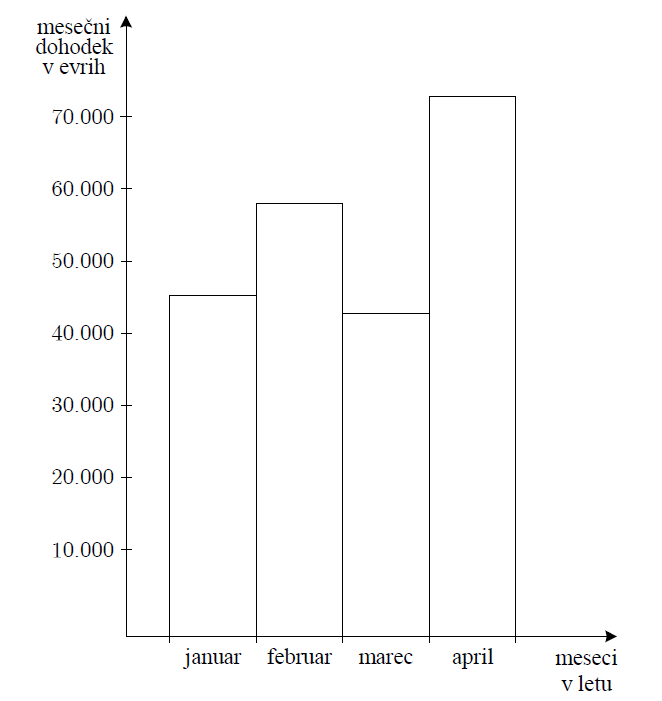
  in February, and three-quarters of February's income in March. The April income was just enough that the company’s plan was achieved.
Calculate what the company’s April income was.
Use a histogram to show the company's monthly income for the first four months of the year.
What percentage of total revenue in the first term of the year did the company generate in February?


 .
.