Personal collections

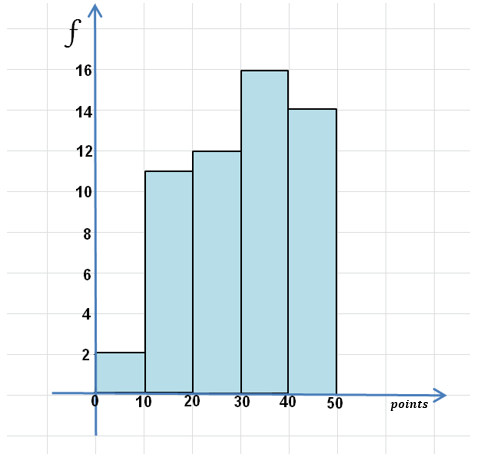
A maximum of 50 and a minimum of 0 points could be scored on the test. Draw a histogram of the data of 55 test participants.
21 32 45 21 20 32 12 32 12 45 33
32 21 41 42 12 32 41 20 31 44 5
32 12 45 49 34 21 32 21 11 10 32
3 21 32 45 42 21 20 34 40 41 12
41 20 32 12 41 10 32 12 32 14 20