Personal collections


The graph of the linear function  is a line with equation
where m and n are from the set of real numbers.
The intercept on y-axis of each function is a point in  . The intercept on y-axis is generally written:

In the case of a linear function for f (0) insert

and we obtain the y-intercepts of the linear function:

If  /, the line passes through the point
  , which is called the coordinate origin.
The number m is named in two ways.
It is most often called the gradient because it determines the direction.
m is also the ratio between the change in the value of the function y and the change in the variable x.
If we know the coordinates of the two points  and
and  through which the line with the equation
  passes, we can calculate the gradient of the line.
The gradient is calculated by inserting two different points into the same linear function:
Let two points be given,  and
and  . The gradient of the line passing through these two points is calculated by the formula:

Lines that have the same gradient m are parallel to each other.
The lines with the gradient  increases and are parallel to the bisectors of the odd quadrants with the equation
  . Gradients and the angle they make with the abscissa axis.
The function is increasing in the case where for any term  and
and  it is considered that if

then necessarily:

If m is a negative number, the function is decreasing. Lines with abscissa axis enclose are greater than  .
.
The function is constant when  .
.
Let's proof:
The equation of the line is thus equal to  and does not change with the value x. The graph of this function is parallel to the abscissa axis.
By definition, the zero of a function is the number  when:
when:

The graph of the zero function intersects the abscissa axis at the point  .
.
Let’s take a look at the procedure for finding the zero function:
In the case that  it is considered that the graph of the function is parallel to the abscissa axis; if
 , then the graph of the function never intersects the x axis.
 , then the graph of the function is exactly the same x axis or abscissa.
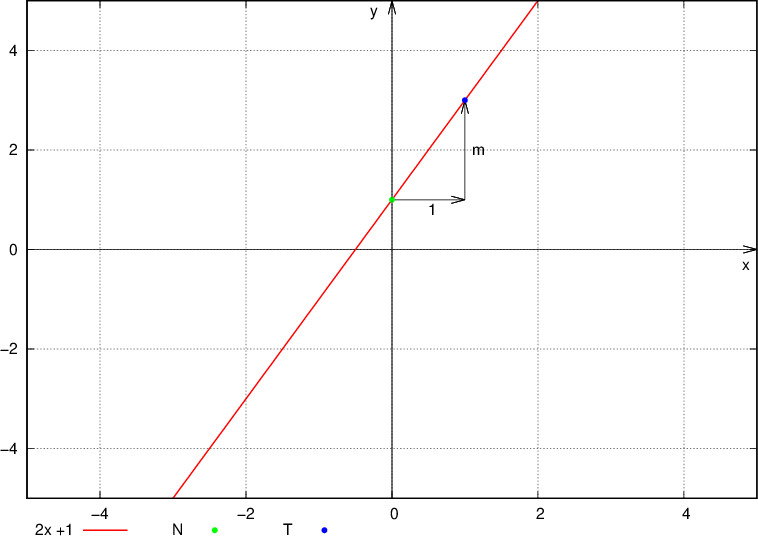
The graph of the linear function can be drawn in two ways.
The first way is to calculate two points and draw a line through both points.
Another way is to use the process of drawing a linear function, where we use the data of the initial value and the directional coefficient of the line.
Let's look at the process:
We draw a point on the ordinate axis with coordinates  , where n is the initial value,
we draw the second point by moving from the first point by one unit to the right and by m units up (or down if m is negative),
we draw a line through both points.

Let’s also look at the absolute value function, whose graph is not a straight line.
Procedure for drawing the  function
We draw a graph of the function f(x)
that part of the line which is below the abscissa is mirrored over the abscissa.
Let's look at an example.