Personal collections


We will also look at the transformations of graphs of the sine and cosine function in the following arears:
Extension along the ordinate (y) axis.
Extension (or contraction) along the abscissa (x) axis.
Rigid shift in the direction of the ordinate axis (shift of the function up or down along the y-axis)
Rigid shift in the direction of the abscissa axis (shift of the function to the left or right along the x-axis).
The value of the angle α is expressed in radians. This means that the value π is equal to 3.14159 ... and not 180°.
When the function sin x or cos x is multiplied by A, where  , we get a new function:


The number A is the amplitude of the function. If
 , this means extension of the function in the direction of the axis y;
 , this means shrinking the function in the direction of the y axis.
If A <0, the function is simply mirrored over the abscissa.
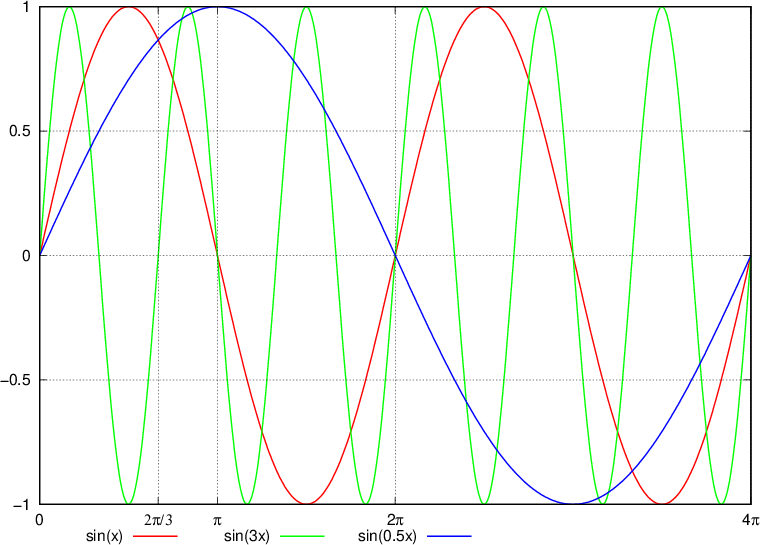
When a constant k is multiplied by x, the extension (or contraction) of the angular function in the direction of the x axis is achieved.
The number k is the frequency of the function, which tells us the number of waves along the length of one period  of the function.
The higher the frequency, the shorter the period. If
 , the function is stretched in the direction of the x-axis,
 , the function shrinks in the direction of the x-axis.
The base period is the distance made by the function before it starts repeating (the base period reflects exactly one round of a unit circle).
The basic period is most easily imagined on the graphs:

In the first (red) graph we read that the base period is  (since at
  the function starts to repeat).
In the second (green) graph we read that the base period is  (since at
  the function starts to repeat).
In the third graph we simply read the basic period  (since at
  the function starts to repeat).
Let's conclude:
The base period of the function  or
or  is
is

If:
 , the period is less than
 , the period is greater than
By moving the function in the y-axis, we move the function in the coordinate system up (n > 0) or down (n < 0).
By moving a function in the direction of the x axis, we move the function in the coordinate system left or right.
The equations are written in the most general possible form:


We plot the graphs by combining all the knowledge from the sections above.