Personal collections


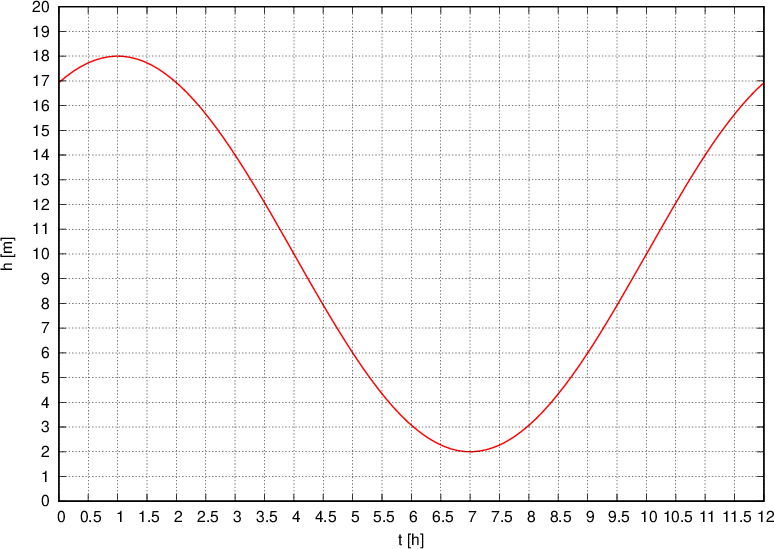
The graph below shows the changes in the water depth h [t] in one day. The time t is given in hours h, from midnight to noon.

From the graph, read when the water reaches a minimum.
From the graph, read when the water reaches its maximum.
The water depth is represented by the function 
Show that A = 8
Calculate the value C.
Calculate the value B.
A sailor knows he cannot sail if the water depth is less than 12 m. Calculate the time when the sailor cannot sail.