Personal collections

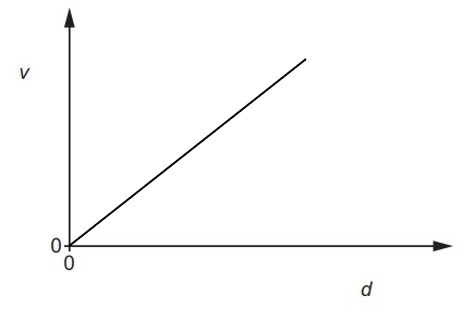
Observations of many galaxies lead to many pairs of values of the distance  of the galaxy from the Earth and the speed
  of the galaxy relative to the Earth. Plotting these values reveals a trend.
On the figure below, sketch the variation of with .
State the name of the quantity represented by the gradient of the line in the figure above.