Personal collections

Figure I below shows the visible part of the emission spectrum from hydrogen gas in a laboratory on the Earth. The numbers indicate the wavelength, in  , represented by each line.
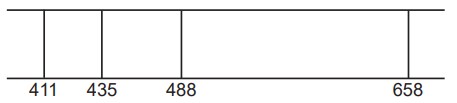
I
The same part of the emission spectrum from hydrogen as in Figure I above, observed in light from stars in a distant galaxy, is shown in Figure II below. The numbers indicate the wavelengths in .
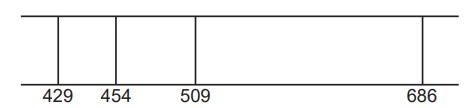
II
The spectrum shows the same pattern as Figure I but with different wavelengths.
State the name of the phenomenon that gives rise to the change in the wavelengths.
State what this phenomenon shows about the motion of the galaxy.


