Personal collections

The graph below shows the number of students enrolled in Colleges A and B from 2018 to 2024.
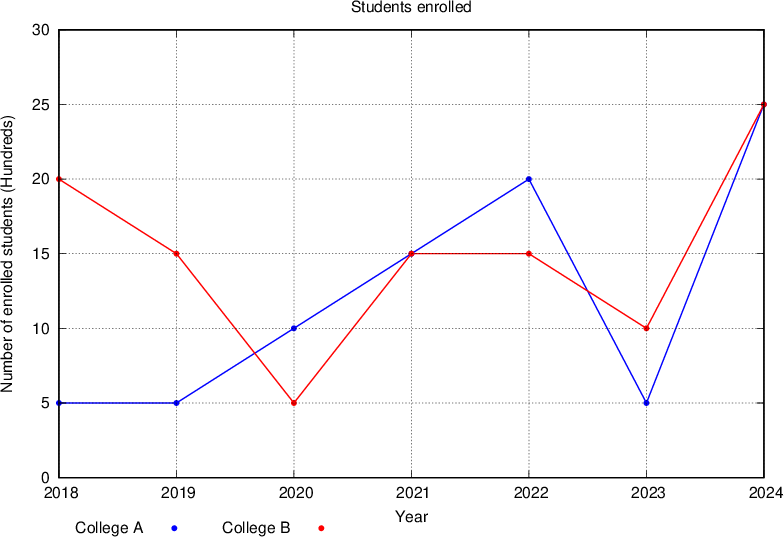
In the year the two colleges had the same number of enrolled students, how many students were enrolled in total by both colleges?


