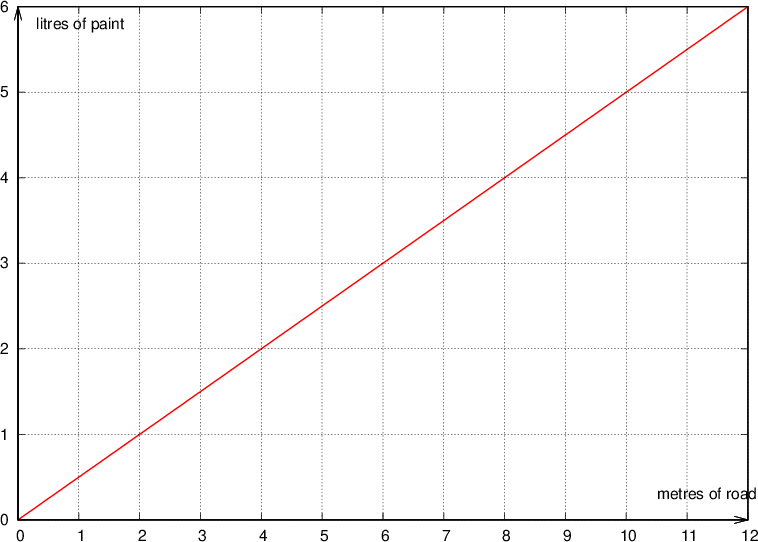

Workers painted road signs on the newly paved road. Color consumption is represented by the graph below:

Find out from the graph how much paint the workers used for 4 m and 8 m of road.
Write the coefficient of the ratio between the length of the road and the paint used.
Calculate how many litres of paint are needed for 100 m of road.