You can only unlock the chapter using a special code that we will send you via the Viber app. Receiving a message is free of charge and with no obligations.
My phone number:
Get a code
In compliance with the law, persons under the age of 15 can enter their phone number only in the presence of a parent or guardian.
4-character (Viber) code:
Check the received code
The page will be refreshed automatically in a few seconds.
To ensure the proper functioning of the website, OpenProf uses cookies that do not store personal data. By continuing to use the website, you agree to cookies. Tell me more »

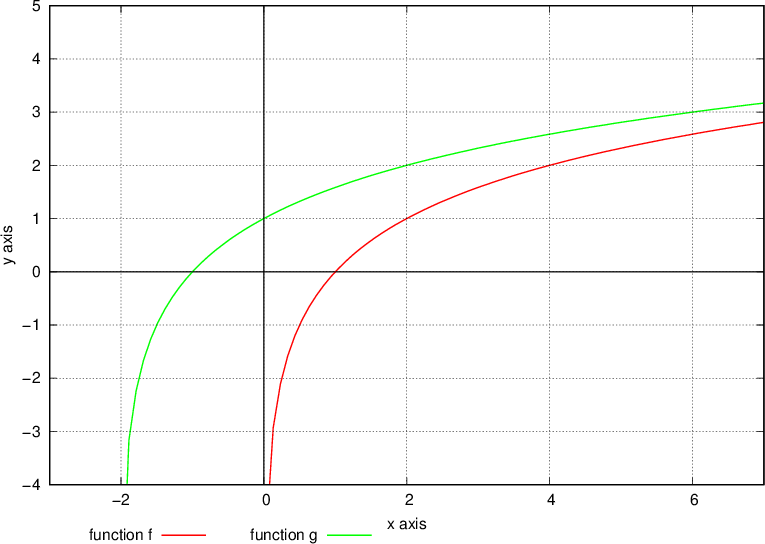
 is moved 2 units to the left to obtain the graph of the function
  .
.