Personal collections

A constant current is maintained in a long straight vertical wire. A Hall probe is positioned a distance  from the centre of the wire, as shown in the figure below.
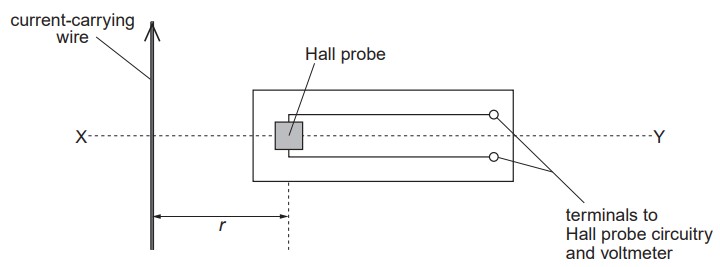
Explain why, when the Hall probe is rotated about the horizontal axis XY, the Hall voltage varies between a maximum positive value and a maximum negative value.
The maximum Hall voltage  is measured at different distances . Data for and the corresponding values of are shown in the table below.
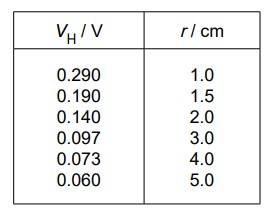
It is thought that and are related by an expression of the form

where k is a constant.
Without drawing a graph, use data from the table above to suggest whether the expression is valid.
A graph showing the variation with  of is plotted. State the features of the graph that suggest that the expression is valid.


 which is given as:


