Personal collections

When we group a set of data and present it graphically, we also wonder if there is some typical value that would describe the whole set of data at once. Such typical values are called parameter. There can be several parameters in a statistical survey, one of the most important is the mean value.
There are several types of mean values, in this material we will learn the following:
arithmetic mean,
mode,
median.
The arithmetic mean is also called the average value. The average value is "the sum of all statistical variables" divided by "the number of all values":
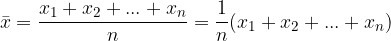
which can be written as:
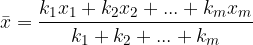
In case the values of the statistical variable are repeated ( values
  ,
,  values
  , etc.), the mean value is calculated according to the equation, which speeds up the calculation a bit:
Note: Both equations for calculating the mean are equivalent; this means that no matter which equation we use, we will always get the same value of the arithmetic mean.
The arithmetic mean is very sensitive to extreme values, especially if they lie on only one side of the data set. In such a case, the arithmetic mean shifts in that direction, and then more so, the farther away the extreme value is.
In case the data were grouped, the arithmetic mean is calculated as follows:
First, for each frequency class, we calculate its own arithmetic mean.
Then we calculate the average of all (calculated under point 1) arithmetic means of the frequency classes.
Note: By grouping the data, we lose some information and therefore the arithmetic mean is only approximately calculated.
Mode (denoted as Mo) is the value that is most often repeated in the set of all values.
The mode in discrete data is the same as the data that occurs most often.
Note: With a small amount of discrete data, the mode is usually a misleading mean.
In case we have the grouped data, we look for the modal class instead of the mode: This is the class that has the highest frequency density.
The mode value is not necessarily always uniquely determined. It may happen that two values occur equally often. If this happens, we say that the distribution is bimodal.
Note: It can also happen that multiple values occur equally often. This is called polymodality.
The median (denoted as Me) is the value of a statistical variable in which half of the values are less than or equal to, and the long half is greater than it.
The median represents the value that represents the mean. We calculate it as:
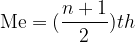
In the case of an even number of data, we find that there is no real mean data. For the median value in this case, we take the arithmetic mean of the two middle observations.
Of all these measures, the median is the least sensitive to extreme values and usually represents the observed data well. It is especially easy to calculate if the data is already sorted by size.


