Personal collections

Students P and Q run in a  race. The figure below shows the distance-time graph for each student during the race.
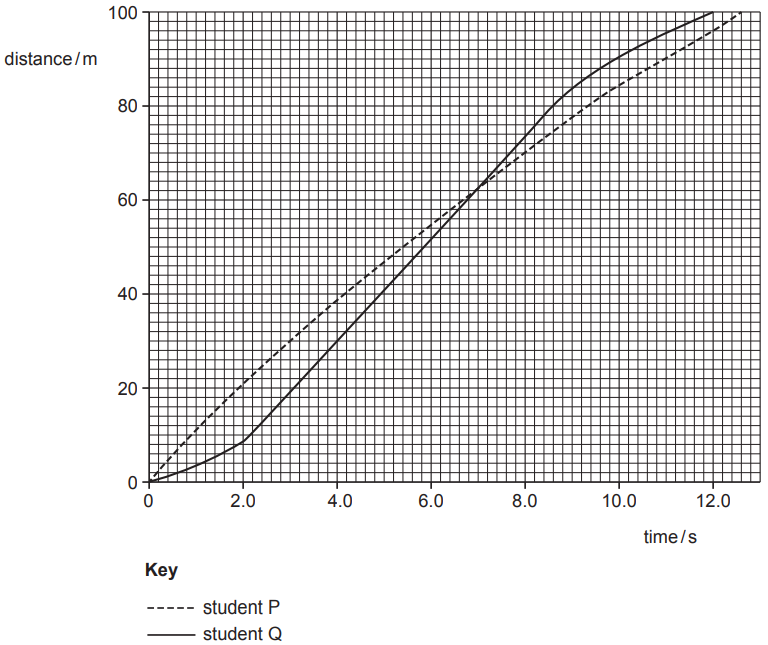
State which student has the faster speed between  and
and  .
.
Explain how the figure above allows you to compare the speeds of the two students without calculation.


