Personal collections

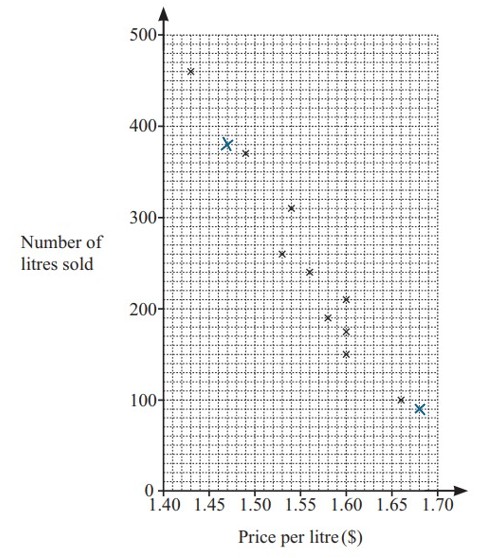
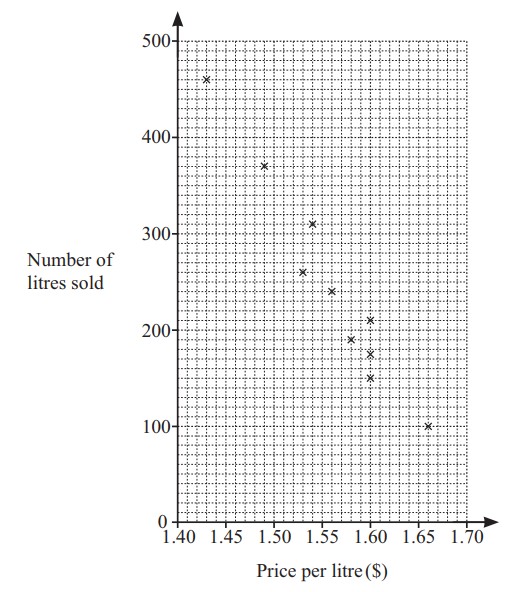
The scatter diagram shows the price of petrol per litre and the number of litres sold at a petrol station on each of ten days.
These are the results for two more days.
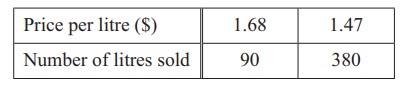
Plot this information on the scatter diagram.