Personal collections

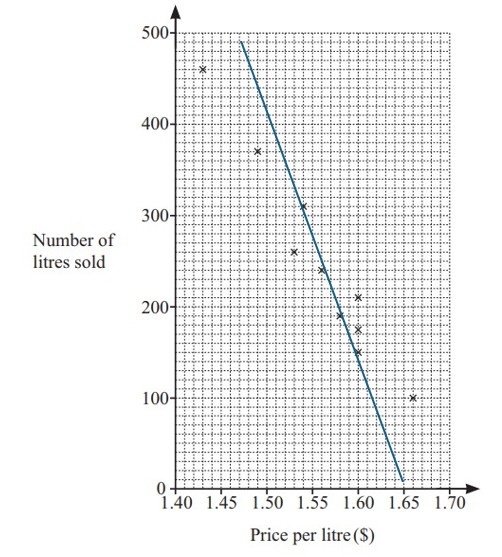
The scatter diagram shows the price of petrol per litre and the number of litres sold at a petrol station on each of ten days.
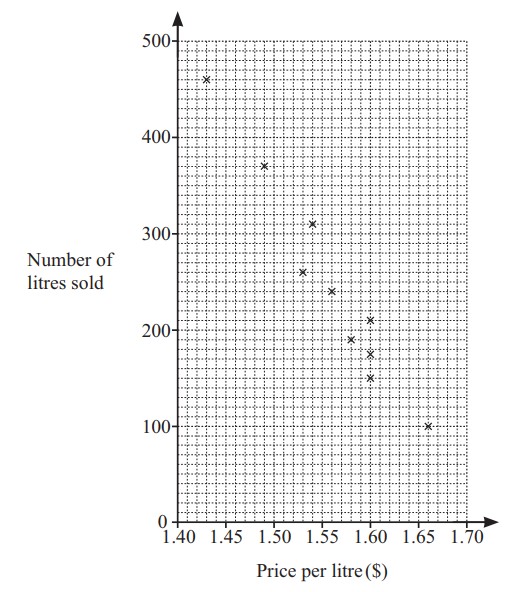
On the scatter diagram, draw a line of best fit.
Use your line of best fit to estimate the number of litres sold.