Personal collections

Jill records the temperature and the number of people on a beach for each of ten days. The results are shown in the scatter diagram.
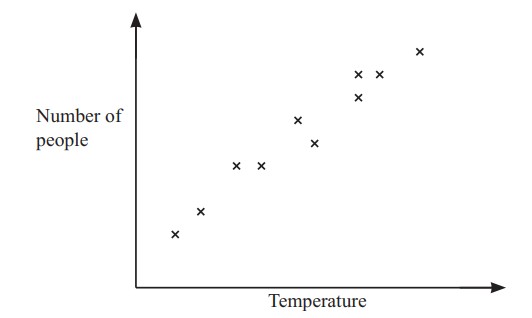
Describe the relationship between the temperature and the number of people on the beach.


