Personal collections

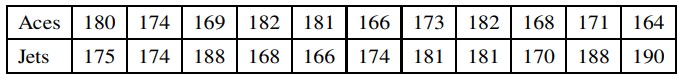
The heights, in  , of the 11 players in each of two teams, the Aces and the Jets, are shown in the following table.
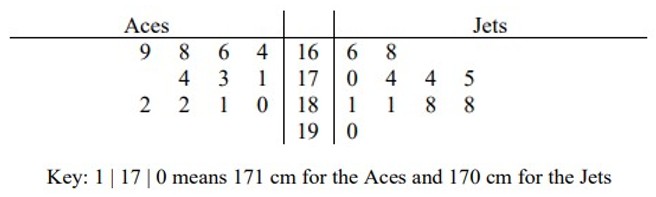
Draw a back-to-back stem-and-leaf diagram to represent this information with the Aces on the left-hand side of the diagram.
Find the median and the interquartile range of the heights of the players in the Aces.