Personal collections

The back-to-back stem-and-leaf diagram shows the annual salaries, in dollars, of 27 employees at each of two companies, Browns and Greens.
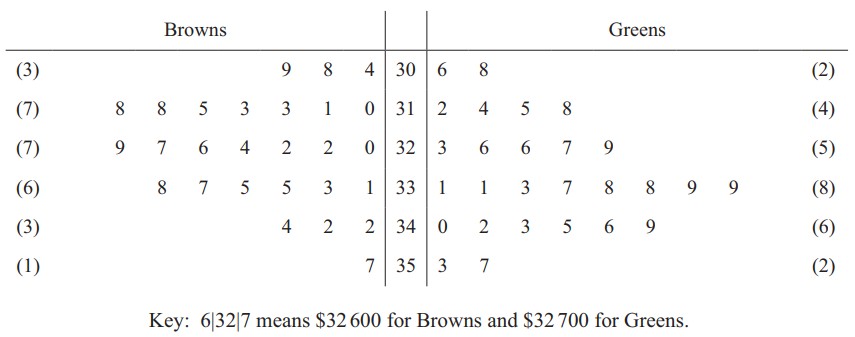
Find the median and interquartile range for the annual salaries of employees at Browns.