Personal collections

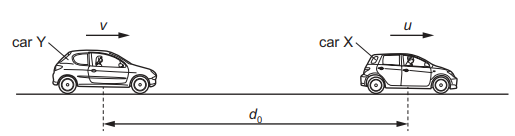
A car X is travelling at a constant speed  along a straight road. At time
  a second car Y is a distance
  behind car X and travelling at a speed
  in the same direction. Speed is less than speed .
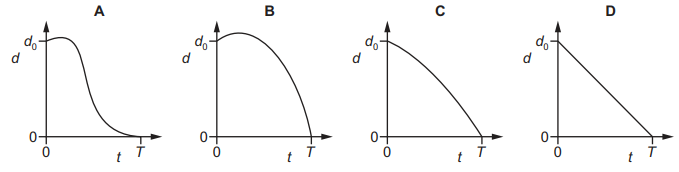
At time car Y begins to accelerate with a constant acceleration. Car Y overtakes car X at time  . Which graph could best show the variation with time
  of the distance
  between the cars?