Personal collections

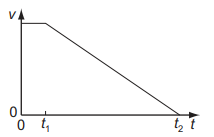
When a car driver sees a hazard ahead, she applies the brakes as soon as she can and brings the car to rest. The graph shows how the speed  of the car varies with time
  after the hazard is seen.
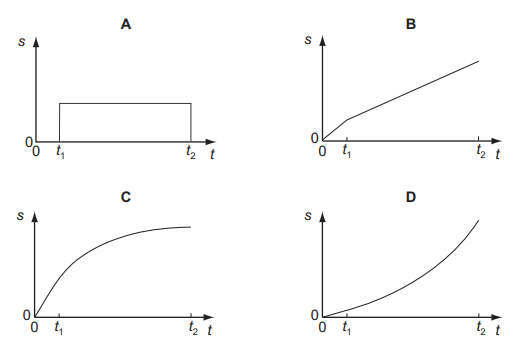
Which graph represents the variation with time of the distance  travelled by the car after the hazard has been seen?