Personal collections

The graph below shows how the speed of a cyclist has changed over time.
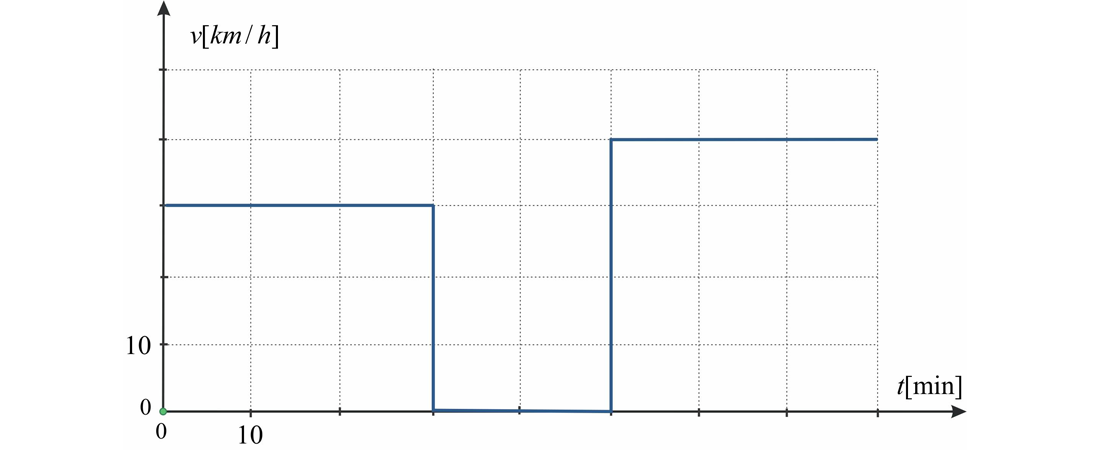
Complete the values on the coordinate axes of the graph and answer the following questions:
Describe the motion of the cyclist?
What was the total cycling time?
What was the total distance travelled by the cyclist?
What was the average speed of the cyclist?
How far did the cyclist travel in the fifth minute?


