Personal collections

The graph below shows how a runner's distance changed over time.
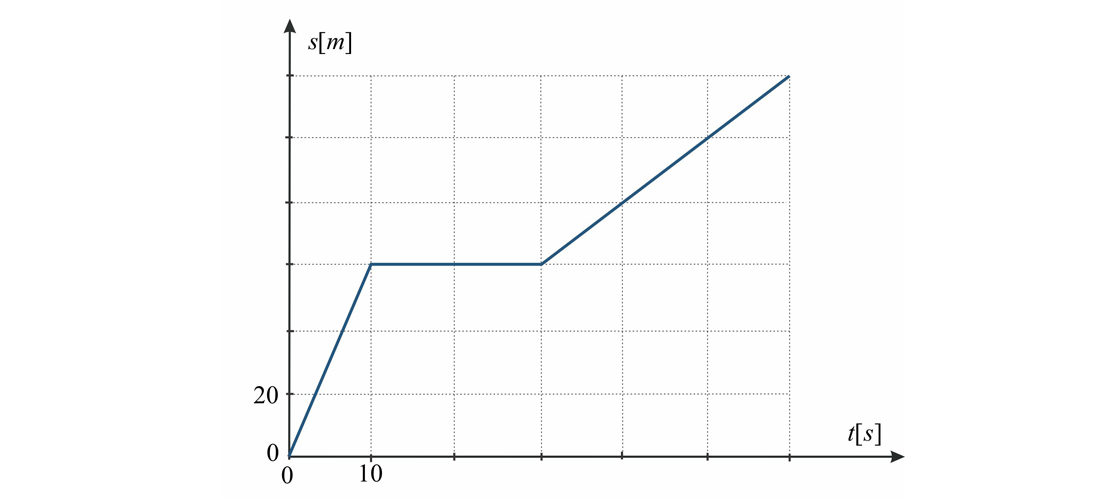
Complete the values on the coordinate axes and answer the following questions:
How long did the runner rest during the run?
What was his speed in the last thirty seconds?
What was his average speed?


