Personal collections

The figure below is a speed-time graph.
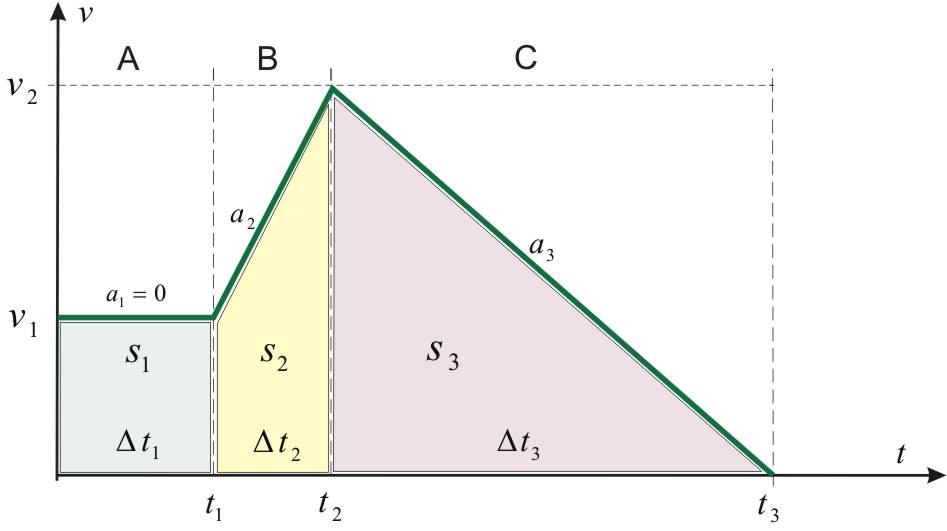
Speed and time graph
The speeds on the graph are,  ,
,  and the times are
  ,
,  ,
,  .
.
Describe the motion.
What is the acceleration in the interval B and C?
What is the average speed of movement?


 .
. .
. .
. .
. .
.

