Personal collections

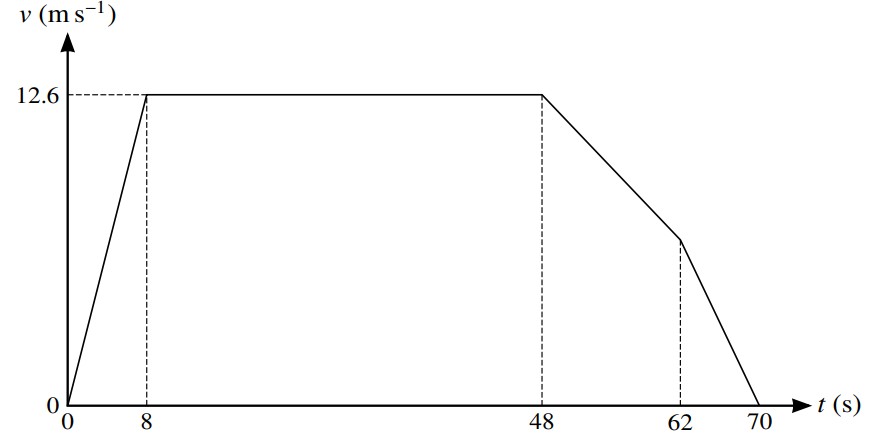
The diagram shows the velocity-time graph for the motion of a bus. The bus starts from rest and accelerates uniformly for 8 seconds until it reaches a speed of  . The bus maintains this speed for 40 seconds. It then decelerates uniformly in two stages. Between 48 and 62 seconds the bus decelerates at
  and between 62 and 70 seconds it decelerates at
  until coming to rest. Find the distance covered by the bus in the first 8 seconds.


