Personal collections

75 people are asked if they have a car,  , and if they have a job,
  . The Venn diagram shows the results.
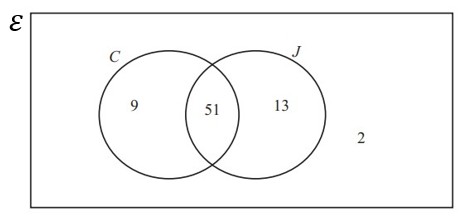
A person is chosen at random from those who have a car. Find the probability that this person also has a job.


