Personal collections

84 people attempt a particular puzzle. The times taken, in minutes, to complete the puzzle are recorded. These times are represented in the cumulative frequency graph below.
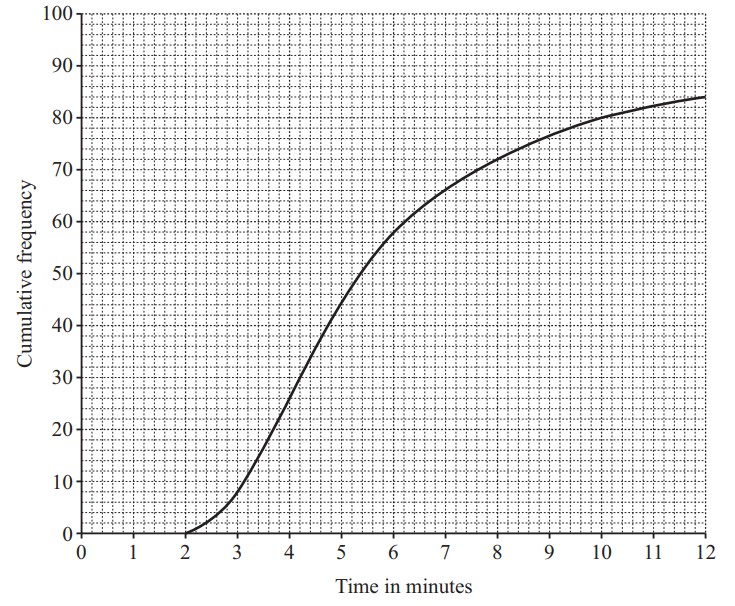
Use the graph to estimate how many people took between 4 and 7.5 minutes to complete the puzzle.


