Personal collections

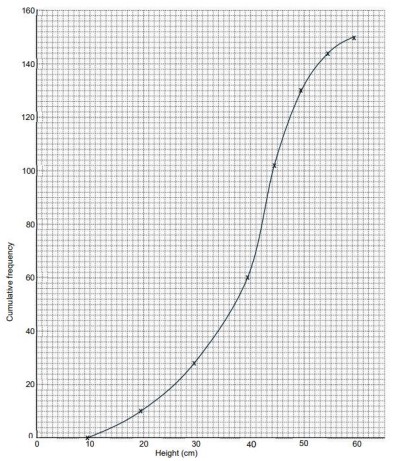
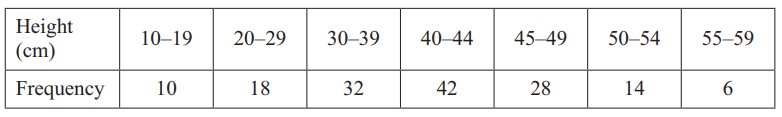
On a certain day, the heights of 150 sunflower plants grown by children at a local school are measured, correct to the nearest  . These heights are summarised in the following table.
Draw a cumulative frequency graph to illustrate the data.