Personal collections

The speed-time graph of the motion of a body is given below:
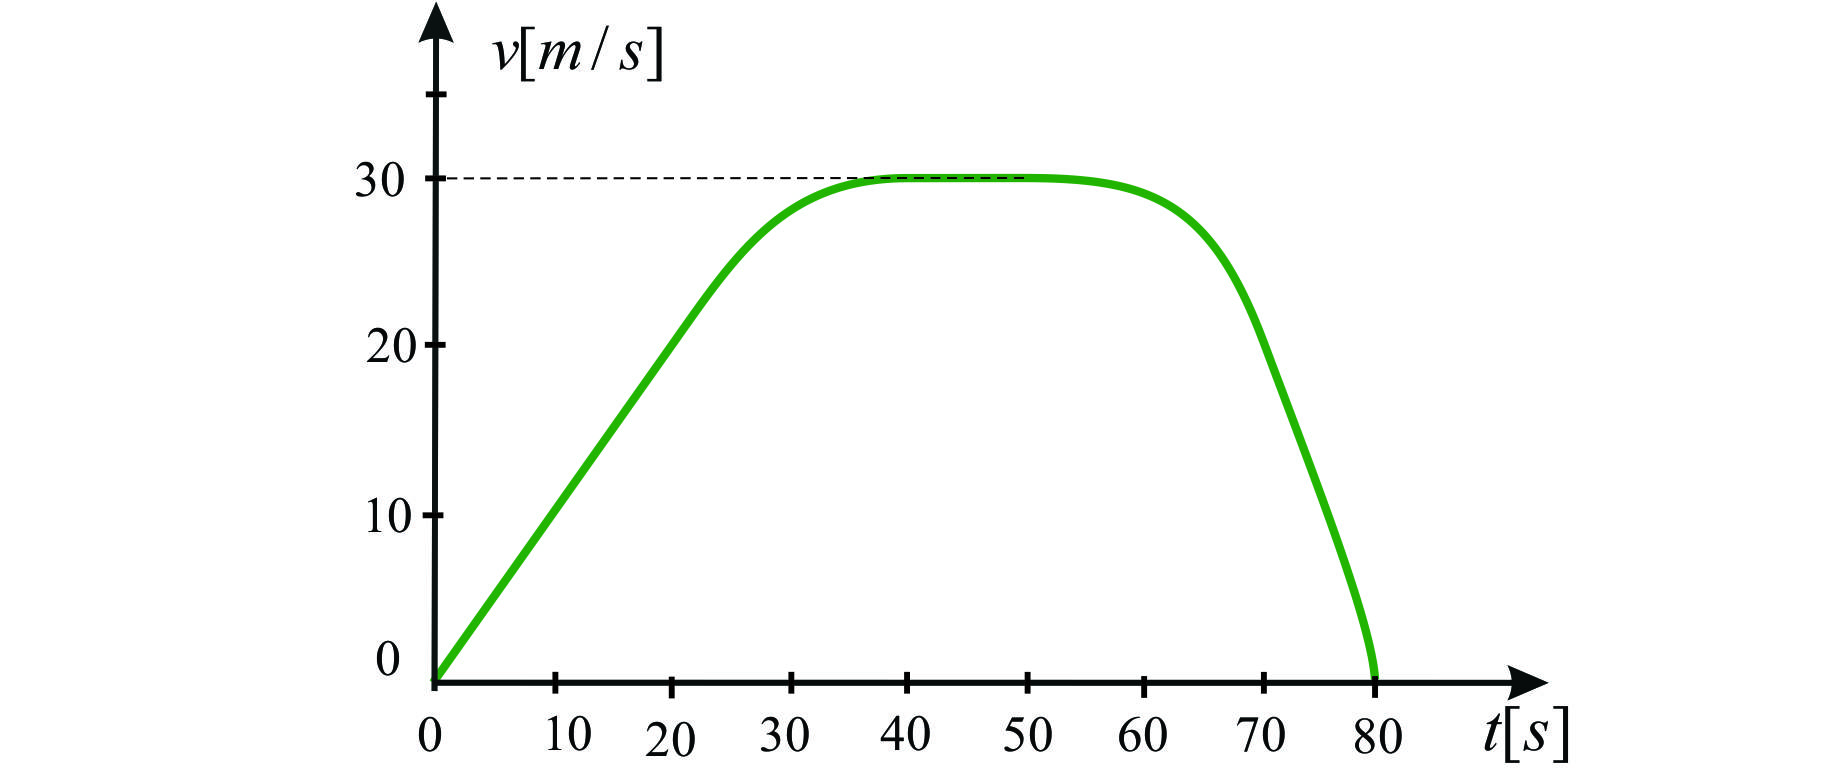
Speed-time graph
Explain how the body moves:
in the first 20 s,
in the time interval from 20 s to 40 s,
in the time interval from 40 s to 50 s,
in the time interval from 50 s to 70 s,
in the time interval from 70 s to 80 s?
For each interval, state the acceleration and calculate it if possible.


 .
. .
. .
.

