Personal collections

A trolley is placed on an inclined slope. A measuring tape is attached to the trolley and the trolley is run over a buzzer. (See picture!) A buzzer is a device that makes a tiny dot on a measuring tape every hundredth of a second. The trolley is made to slide down the slope, marking every fifth dot on the measuring tape and the distance between the points is measured.
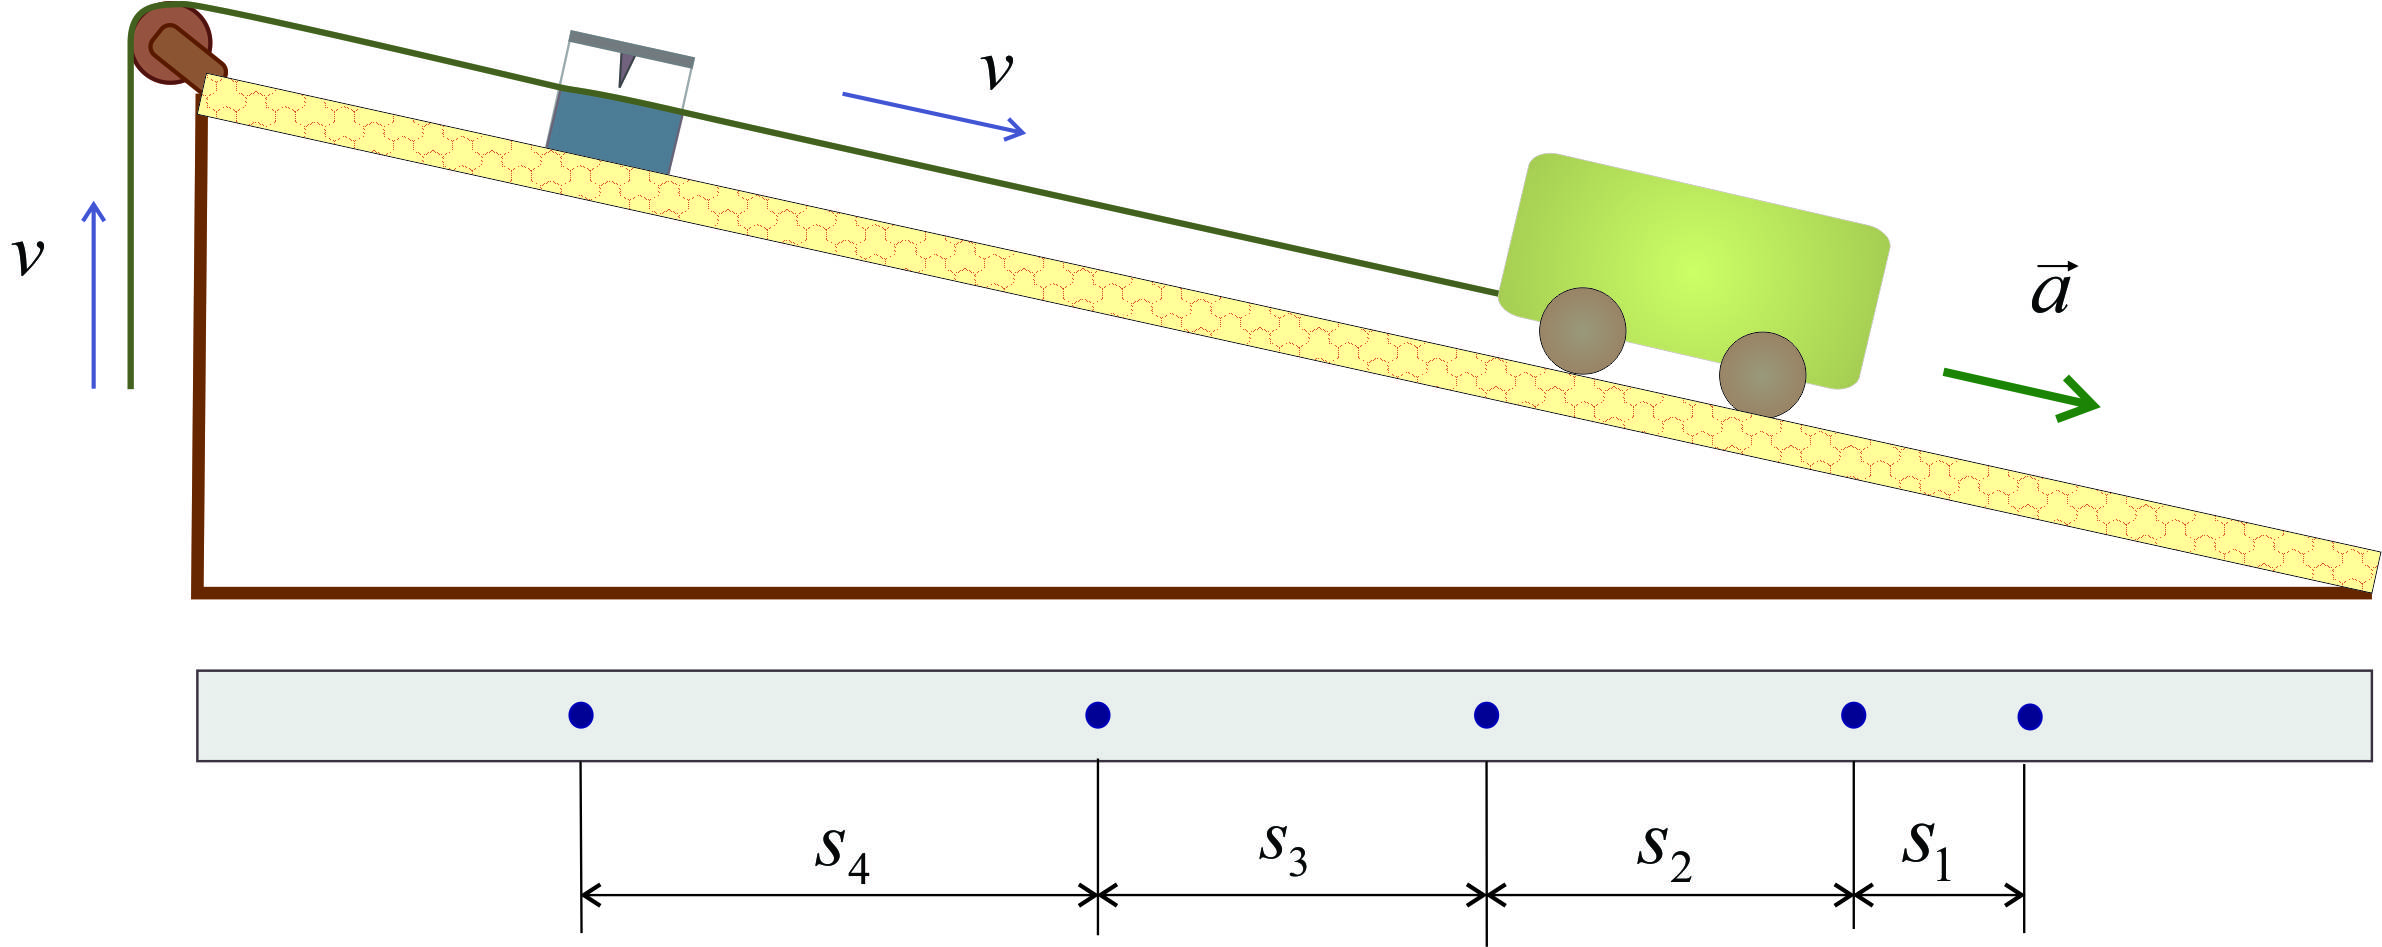
Measurement of acceleration on an inclined slope
The following distances were recorded:


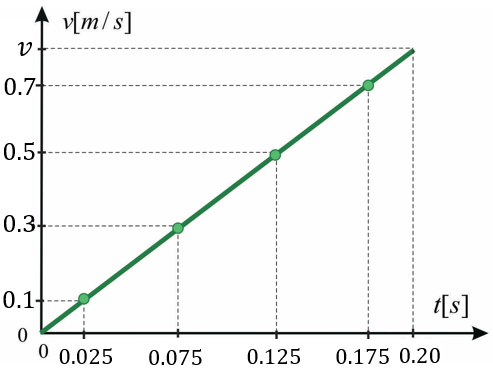
Calculate how the average velocity changed between the two marked points and draw a graph of velocity against the time.
Calculate the acceleration and final velocity of motion.
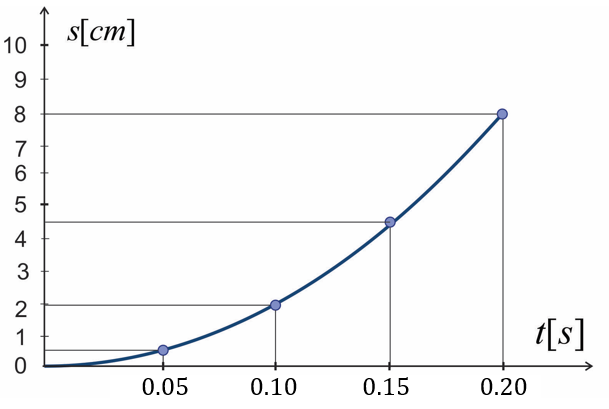
Draw a graph of the distance against the time. (The scale should be in cm and s.)
What was the average speed during the whole motion?


 .
. .
.
 .
.

