Personal collections

In the chapter, Thermal Equilibrium, we learned how the aggregate state of matter changes if heat is added or removed from it. As an example, we took water in a solid state - ice, heated it (supplied heat), and measured the temperature. The ice first warmed up to the melting point temperature  , after which it began to melt. Until it completely melted, its temperature remained unchanged. Only when the ice had completely melted did the temperature begin to rise. It rose until the boiling point temperature
  when the water boiled. During the constant addition of heat, the water gradually turned into steam - a gaseous state, and the temperature remained unchanged until the water completely evaporated. Only did the temperature begin to rise again.
In this chapter, we will see that the melting point and boiling point of a substance depend not only on temperature but also on pressure.
We will learn what evaporation, saturated vapour pressure, and relative humidity are and how they depend on temperature.
The change of state diagram shows us under which conditions (pressure, temperature) a substance is in a solid, liquid, or gaseous state and when a substance changes from one state to another.
As an example, let's look at the water state diagram:
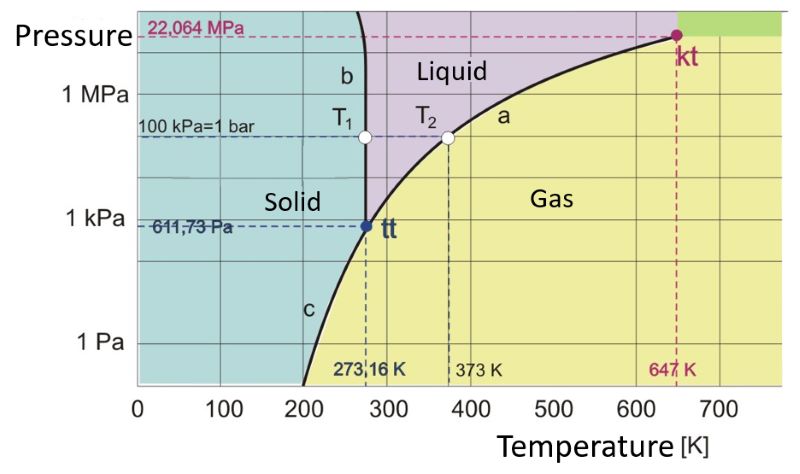
Figure 1: Water state diagram
The axes of the diagram are:
x-axis: absolute temperature (Kelvin)
y-axis: pressure (Pascal)
As an interesting point, let's first look at an example from practical life: at a pressure of 1 bar (as much as the pressure at the surface of the Earth), two points are marked on the diagram:
point  which represents the melting point temperature. This temperature is 273 K (or 0 degrees Celsius); as we know this is the freezing temperature.
point  which represents the boiling point temperature. This temperature is 373 K (or 100 degrees Celsius); as we know this is the boiling point.
Let's describe the diagram itself. We notice that the diagram is divided into three regions, where each part represents one state of matter:
gaseous state of water (steam);
liquid state of water (liquid water);
solid state of water (iced water).
Here we notice a special point marked tt on the graph, where all three regions (a), (b), and (c) meet. This point is called the triple point, and at this point, all three phases of matter are in equilibrium: solid (ice), liquid, and gas (steam). Or to put it another way: at this point, water simultaneously freezes, evaporates and directly changes from a solid to a gaseous state (sublimes). The point is located at a temperature of 273.16 K or and a pressure of 611.73 Pa, which is about 0.6 % of normal air pressure (1 bar).
Let's take a closer look at the regions (a), (b), and (c). These regions represent state transitions and demarcate different states of matter:
Region (a)
Region (a) represents the dependence of pressure on temperature when water is in equilibrium with steam - the boiling point.
From the diagram, we can see that the higher the pressure, the higher the boiling point. At the end of this region is the critical point kt. It is located at a temperature of 647 K and a pressure of 22 MPa. This is the limit point when we can no longer distinguish between the gaseous and liquid states of a substance.
We notice the point on the region. As said, this is the boiling temperature at a normal air pressure of 1 bar (the boiling temperature at the mentioned pressure is therefore 373 K or ).
Region (b)
Region (b) represents the equilibrium between solid and liquid - the melting point.
From the diagram, we can see that at high pressures the melting point temperature drops. Water melts at a lower temperature, which is in line with the examples we learned about in the introduction.
We notice the point on the region. As mentioned, this is the melting point temperature at a normal air pressure of 1 bar (the melting point temperature at the mentioned pressure is therefore 273.16 K or ).
Region (c)
Region (c) represents the equilibrium state between the solid and the gaseous states.
It occurs at pressures lower than the triple point pressure - 611.73 Pa. Water goes directly from solid to gas or vice versa. The phenomenon is called sublimation, and the reverse process is called deposition or desublimation. For sublimation, it needs heat from the surroundings, during desublimation it emits heat to the surroundings.
Water changes from a liquid to vapour even at a normal air pressure of 1 bar and temperatures below the boiling point. We say it evaporates.
The mechanism of evaporation is understood if we know that water molecules have a certain speed or kinetic energy due to heat. If a single molecule has enough kinetic energy at a certain moment, it can leave the water and appear in the air as a gas. If the space where the water molecule evaporates is open, sooner or later the water evaporates completely.
If water evaporates in an enclosed space, the water vapour causes the air pressure to increase by the partial pressure  of the water in the air.
We can also calculate the partial pressure of the water vapour using the gas equation:
where  is the kilomolar mass of water which is
  .
.
Evaporation sooner or later stops due to the increase in the partial pressure of water vapour in the air. When it will stop depends on the average speed of the molecules in the air - that is, the temperature. When the number of molecules leaving the water vapour in the air equals the number of molecules returning to it, we say that the air is saturated with moisture.
Figure 2 shows the relationship between the saturated vapour pressure and temperature.
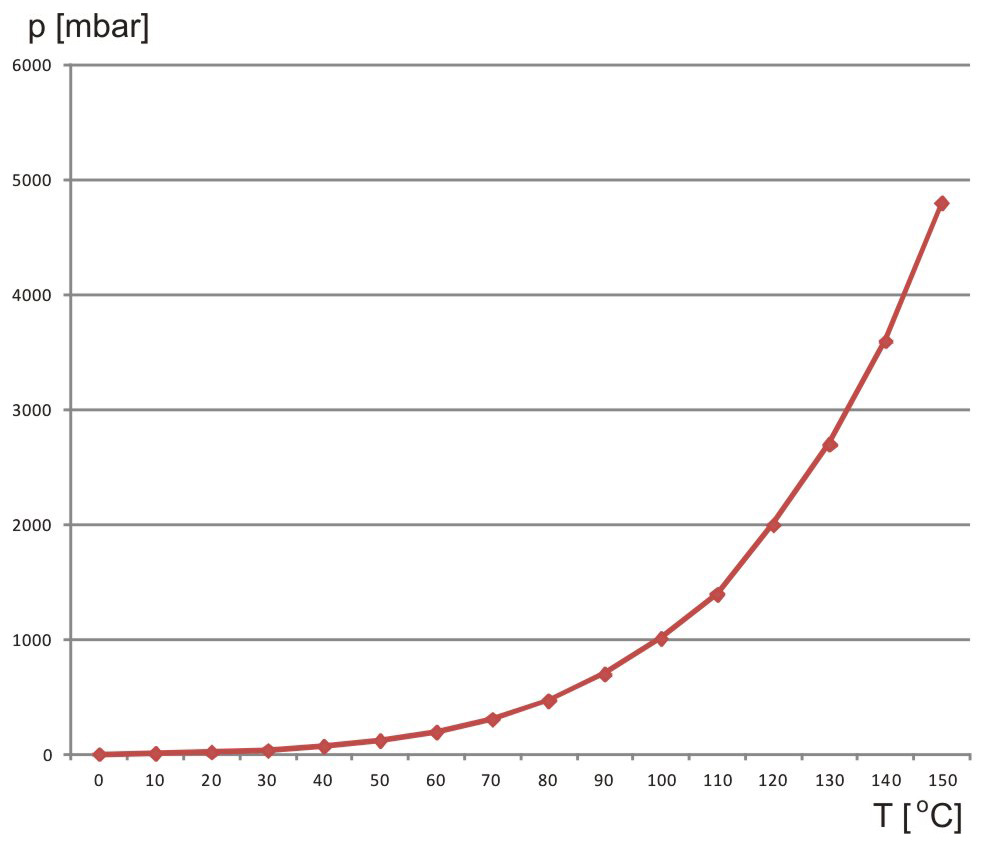
Figure 2: Graph of the saturated vapour pressure against temperature
Let's also define the concept of relative air humidity.
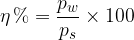
Relative humidity tells us what the partial pressure of water vapour is relative to the pressure of saturated water vapour. It is most often expressed in percentages:
The relationship between the pressure of saturated water vapour and temperature can also be expressed on a table:
Saturated water vapour pressure is the maximum possible partial pressure of water vapour in the air. The water can then no longer evaporate. It depends on the temperature  .
.
Relative air humidity is the ratio between the water vapour pressure  in the air and the saturated vapour pressure
  :
:
100% humidity means that the partial pressure of water vapour in the air is equal to the saturated vapour pressure.


